Deutsch Deutsch |
Solar Eclipse 2015 - Determining the degree of occultation of Sun | ||||||||||||||||||||||||||||||||||||||||||||||||||||
|
4a. Determining the degree of occultation of Sun I got a simple but a bit inaccurate overview, by putting the chord, which was formed by the circular portion of the moon, in relation to the solar diameter. I did this with all my pictures and obtained a first approach to the occultation as a function of time. Laborious, but more accurate is the comparison of surfaces. So I created printouts of my pictures on graph paper. I determined the center of the sun by the method of 2 chords and their perpendicular bisectors. I have already described this geometric operation at my page of the transit of Mercury (left picture, Fig. 35). So the center of the sun was constructed. By measuring the solar diameter I completed the covered solar disk. Later on I counted the bright boxes and substracted the result from the value of the full solar disk. Finally, I put the obtained outcome in relation to the total solar surface (right picture, Fig. 36). 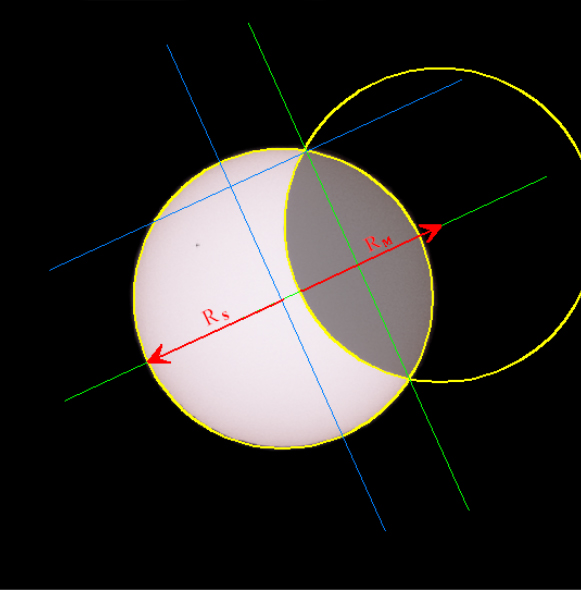
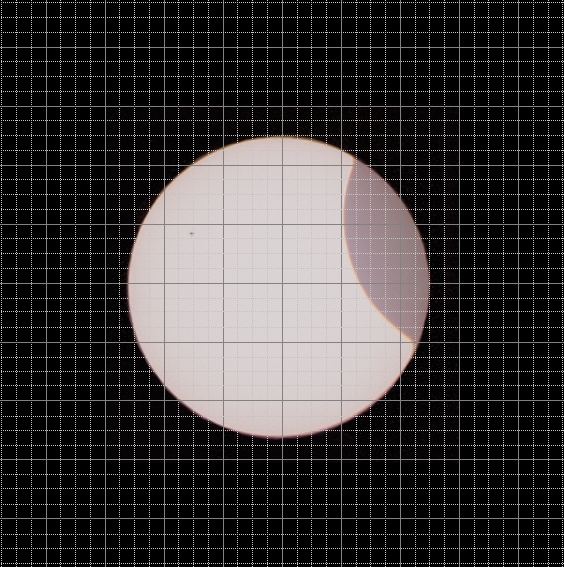
In Fig. 35 it is shown additionally, how the moon's center was determined. The centers of the two celestial bodies are actually located on the mid-perpendicular of the chord, which is formed by the circular portion of the moon. By measuring the solar radius from the edge of the moon, I easily found the moon's center.
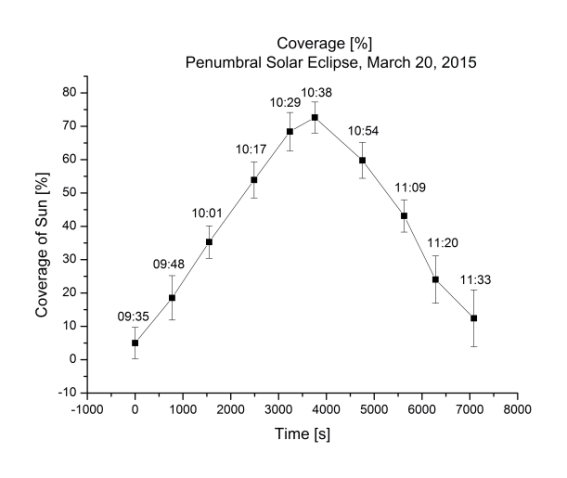
Table 3: Solar Eclipse on March 20, 2015 as funktion of time (occultation, partial eclipse and error), observed at 'Ludwigshöhe' near Darmstadt, Gemany (coordinats: 49.84296° N; 8.660990° E)
Extrapolating the measured or calculated results as a function of time, you get
the course of eclipse in terms of occultation (see:
Fig. 37).
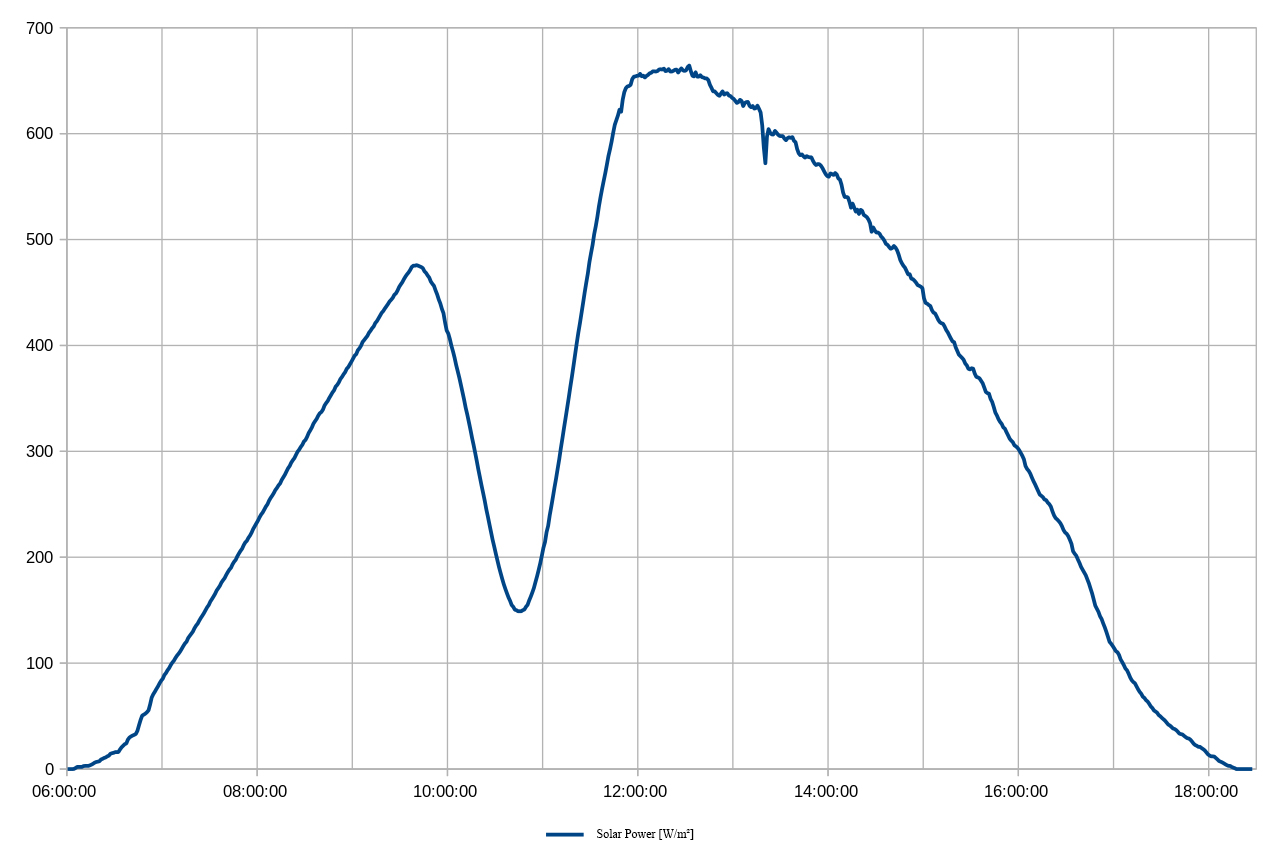
Previously various media expressed the fear, that during the Eclipse the power supply in Germany could collapse, since the Photovoltaic bears a large share of the energy supply. But this did not happen, as you will see at German-power-net-survives-solar-eclipse Reference: ( © Radio Deutsche Welle ).
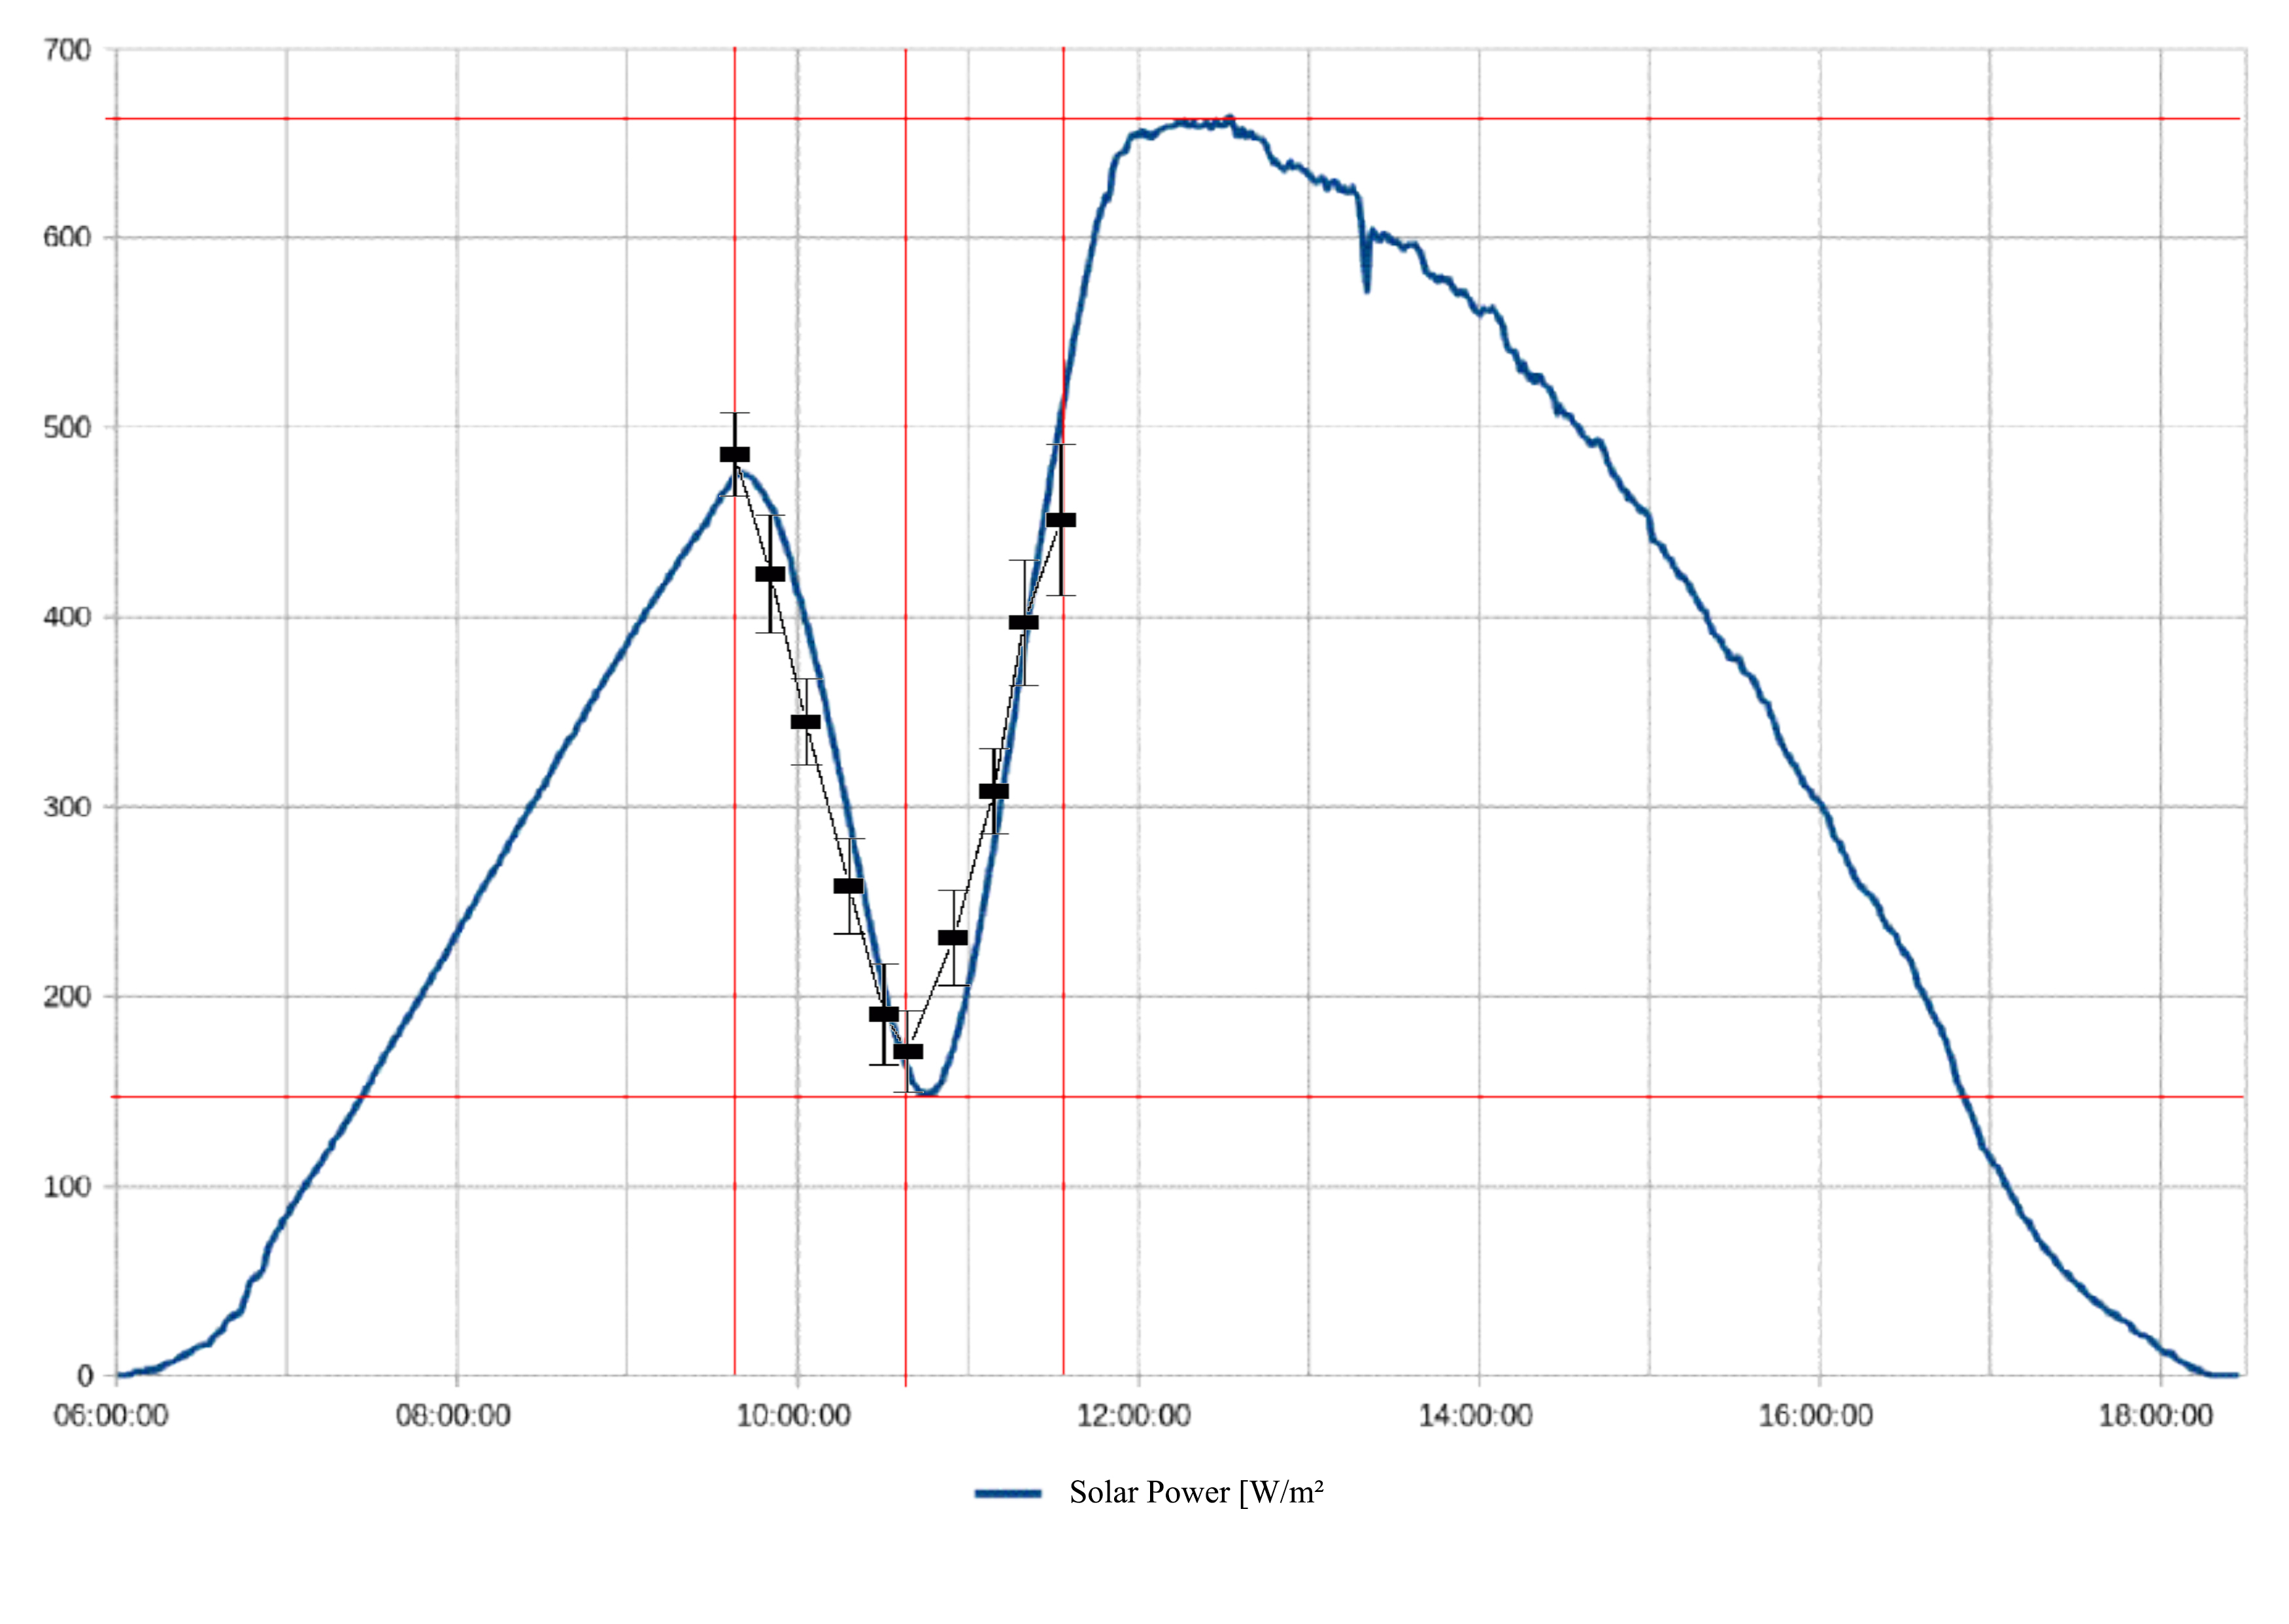
At Wikipedia I found the course of solar power at a photovoltaic system in Dresden, Germany (sorry, this page is in German language only; see: Fig. 38). The darkening of the sun Vs(t) can be calculated using my determined occultation Bs(t) according to the relationship: I compared the images and recognized a good correlation (see: Fig. 39). Because Dresden is about 360 km east of Darmstadt, this sets the eclipse later. The percentage of sun-occultation is lower, since the umbra east veers to the north (see: Fig. 30). Read more at: 5. More to Explore and get a better understanding of eclipses. Back to top Back to evaluating the image sequence Back to directory | |||||||||||||||||||||||||||||||||||||||||||||||||||||
| Copyright by Hans Joachim Ilgen since 1950 | |||||||||||||||||||||||||||||||||||||||||||||||||||||